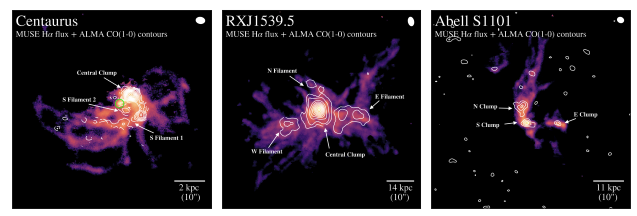
We began with the calibration and analysis of ALMA data (for three newly observed sources). Subsequently, we performed new calibration and analysis for 13 additional sources extracted from the ALMA data archive. Each observation represents approximately 2 terabytes of data and required several days of processing. This substantial work necessitated the use of the appropriate computational infrastructure provided by the Paris Observatory, as well as dedicated storage space. We also analysed VLT/MUSE data for this sample of Central Cluster Galaxies.. This multi-wavelengths study of filaments was the core of Valeria Olivares’ thesis work. These studies demonstrated the systematic existence of massive and long molecular filaments (3-25 kpc), which are preferentially located around radio bubbles inflated by the AGN. These filaments are always found in regions of low entropy, where the intra-cluster gas cooling time is very short (Olivares et al., 2019). A second set of MUSE observations (18 Central Group Galaxies) was carried out to extend the analysis to galaxy groups (less massive objects where galaxy collisions are more frequent). LYRICS showed that the ionised gas is kinematically decoupled from the stellar component for most systems, suggesting again an external origin for the gas (accretion). As in the case of clusters, ionised filaments and the associated cold gas are formed from condensations of hot halo gas through thermal instabilities (Olivares et al., 2022). As expected, the measured fluxes as well as the morphology and dynamics of the gas provided useful constraints for the modelling of filament formation and excitation (WP2 and WP3).

Figure : Logarithmically scaled Hα flux maps from MUSE observations overlaid with contours from the CO(1-0) integrated intensity maps for three new ALMA sources: Centaurus (left panel), RXCJ1539.5−8335 (middle panel), and Abell S1101 (right panel). The co-spatial and morphological correlation between the warm ionized and cold molecular nebulae is clear in these maps. The CO(1-0) emission has been continuum-subtracted and binned from −300 km/s to +300 km/s. The ALMA beam is shown in the upper right corner of each panel. The CO(1-0) contours for Centaurus are: 3σ, 5σ, 7σ, for RXCJ1539.5−8335 are: 3σ, 10σ, 30σ, 50σ, 70σ, etc., and for Abell S1101 are: 3σ, 5σ, 7σ. In the panel showing the data for Centaurus, the small green circle indicates the location of the highest surface brightness Hα emission without any CO emission.

